

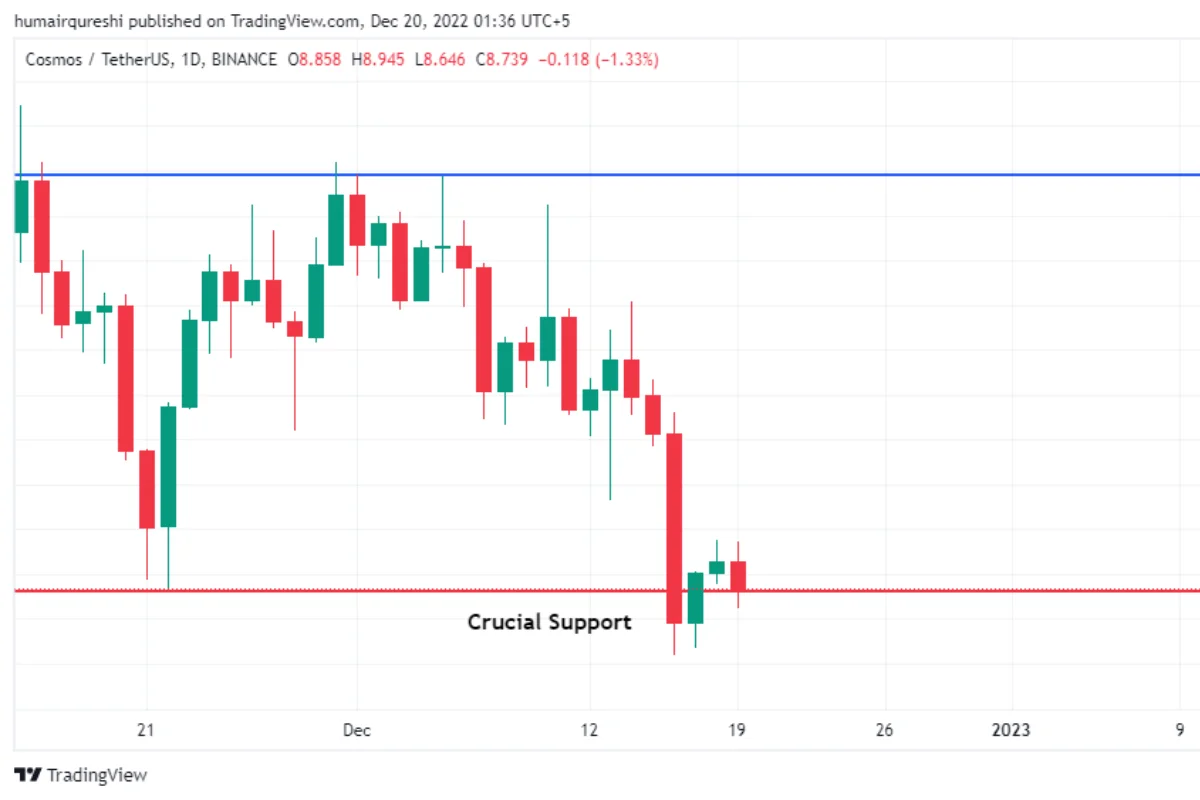
Cosmos ATOM chart Analysis should be more cautious because the ATOM broke on May 12, a crucial support day after the Terra Luna collapsed, and now the cosmos should move down or go higher depending on today’s daily closing.
Crypto Avanza already warns our readers in our previous blog you can check more fundamental detail on it. Now we are talking technical charts in today’s blog.
Now ATOM/USDT breaks a crucial spot which is $8.7 on the day when the Binance FUD drama hype on Twitter so every fearful trader cashout his assets and on 13 December Binance outflows more than 3 billion in just 24 hours.
On 16 December ATOM/USDT breaks Crucial Support and closed below crucial Support but next the candle closed above the support and now today’s daily closing will give a clear direction for the next ATOMUSDT move
However, I informed ATOM token holders in early December on Twitter, where I posted, “Short is more SAFU than Long.” My short trade is still active, and I’m in profit by more than 50% because I always use 3x leverage because I believe regular growth does not happen overnight. Avoid leverages of 50x to 100x.
$ATOM
Short is more #SAFU then long
**Not a financial advice** pic.twitter.com/hsBTC7DbXt— Muhammad Humair Qureshi (@BiWithHumair) December 5, 2022
In a weekly timeframe, see the broad picture of ATOM/USDT when the LUNA UST drama happens in May, starting with the price of the coin plummeting and making a bottom in June, then the ATOM/USDT market structure moving forward to an uptrend, but after September’s $17 high, now the market structure is in a downtrend.
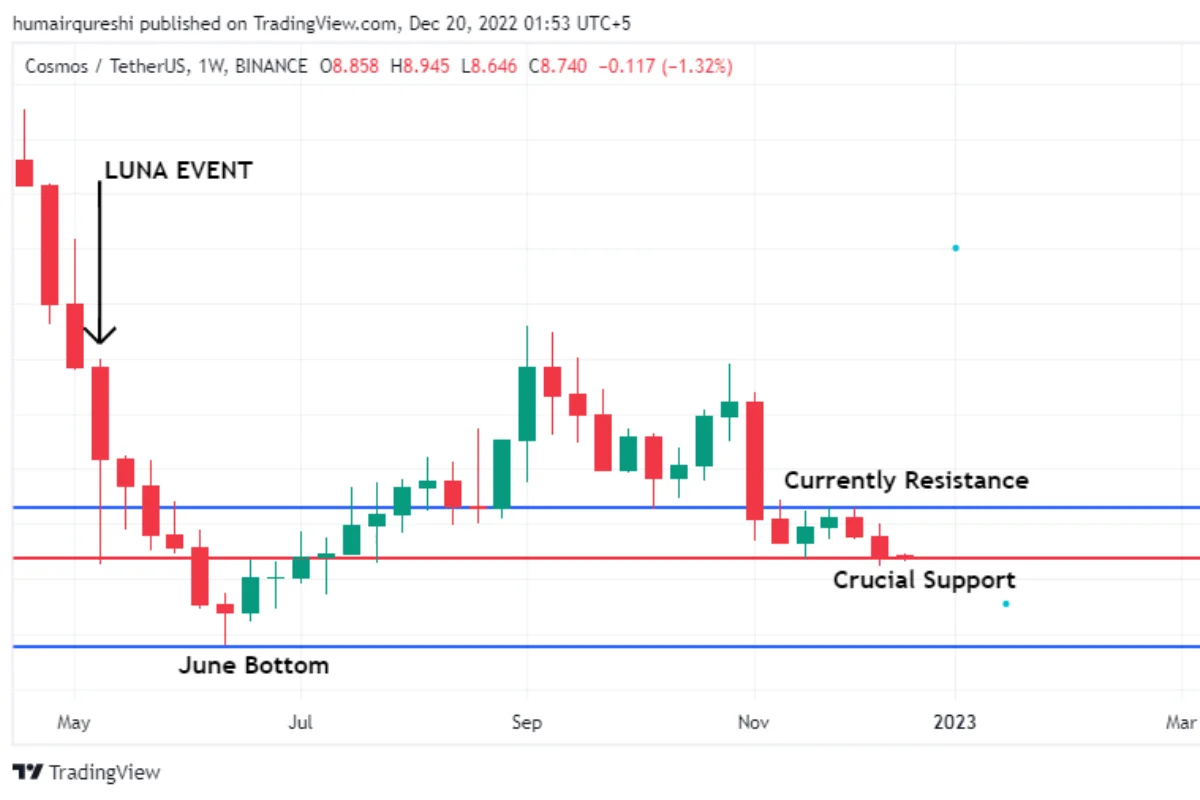
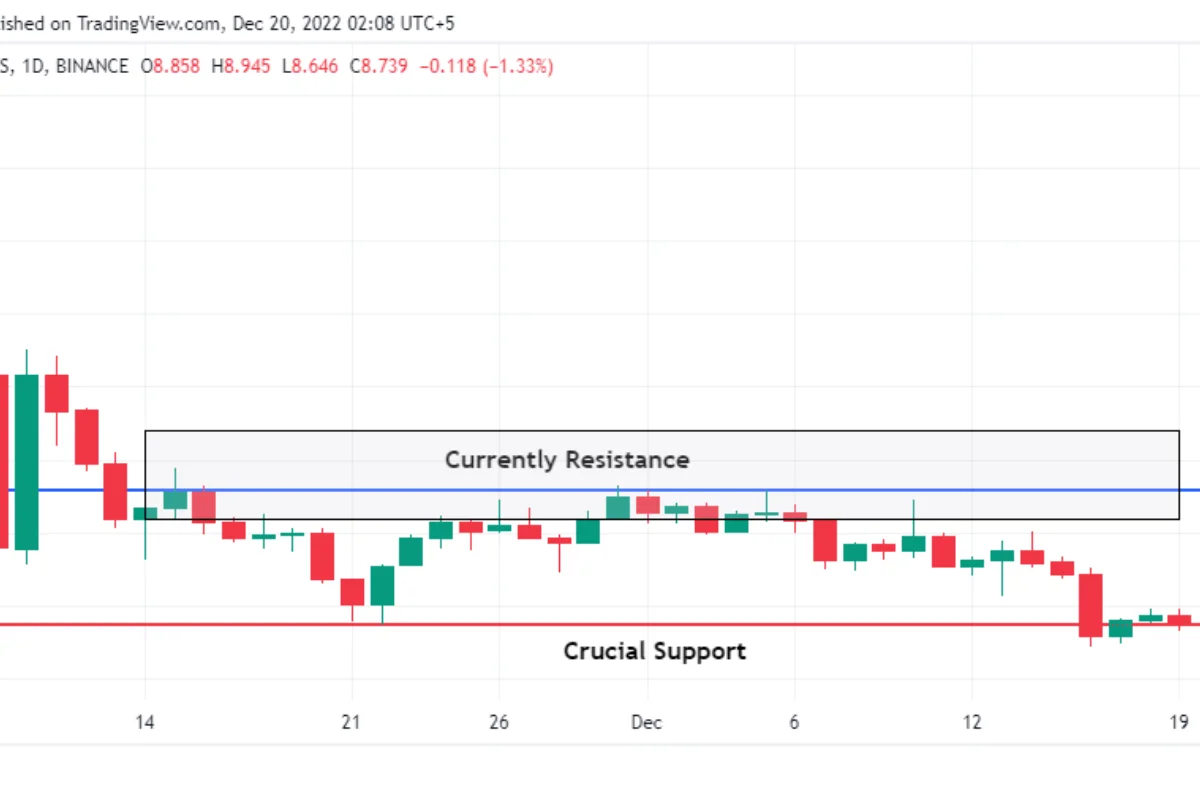
If the weekly close falls below the critical support, we expect ATOM to trade at $6 in the coming weeks. According to the above chart, ATOM/USDT was unable to break through the $10.5 resistance level from November 14th until today.
From November 14 to today, we can see in the chart below that ATOM/USDT has been resisting the $10.5 level for a total of 34 days, more than a month. Cosmos has been unable to break the current resistance area, and now we will see how ATOM survives the critical support.
Conclusion on Cosmos ATOM Chart Analysis
As per the discussion, the ATOM/USD charts look weak, which is why I took a short opportunity in early December; now that I’ve booked my half profit, I’m still in this short trade. I weekly analysis the market structure what the chart is saying and what the current fundamental to me to particular crypto coin
“NOT A Financial Advice”